SpatialScale January 2022 Release
Hello SpatialScale community! We’re thrilled to announce some amazing updates that will make your geospatial work even more powerful and fun. Let’s dive into the January 2022 release and see what’s new!
Pedestrian Mode
Explore maps from a ground-level view with our new Pedestrian Mode. Navigate through terrains and 3D materials just like you're walking around a city. This feature is perfect for smart city planning and general map exploration. You’ll love seeing your data from this fresh perspective!
Story Maps
Now you can create and share engaging geospatial presentations with Story Maps. Combine 2D and 3D elements to tell your data story in a visually stunning way. It’s like creating a digital twin of your world. Share your stories easily on the web and captivate your audience with powerful visuals.
Share Your Maps
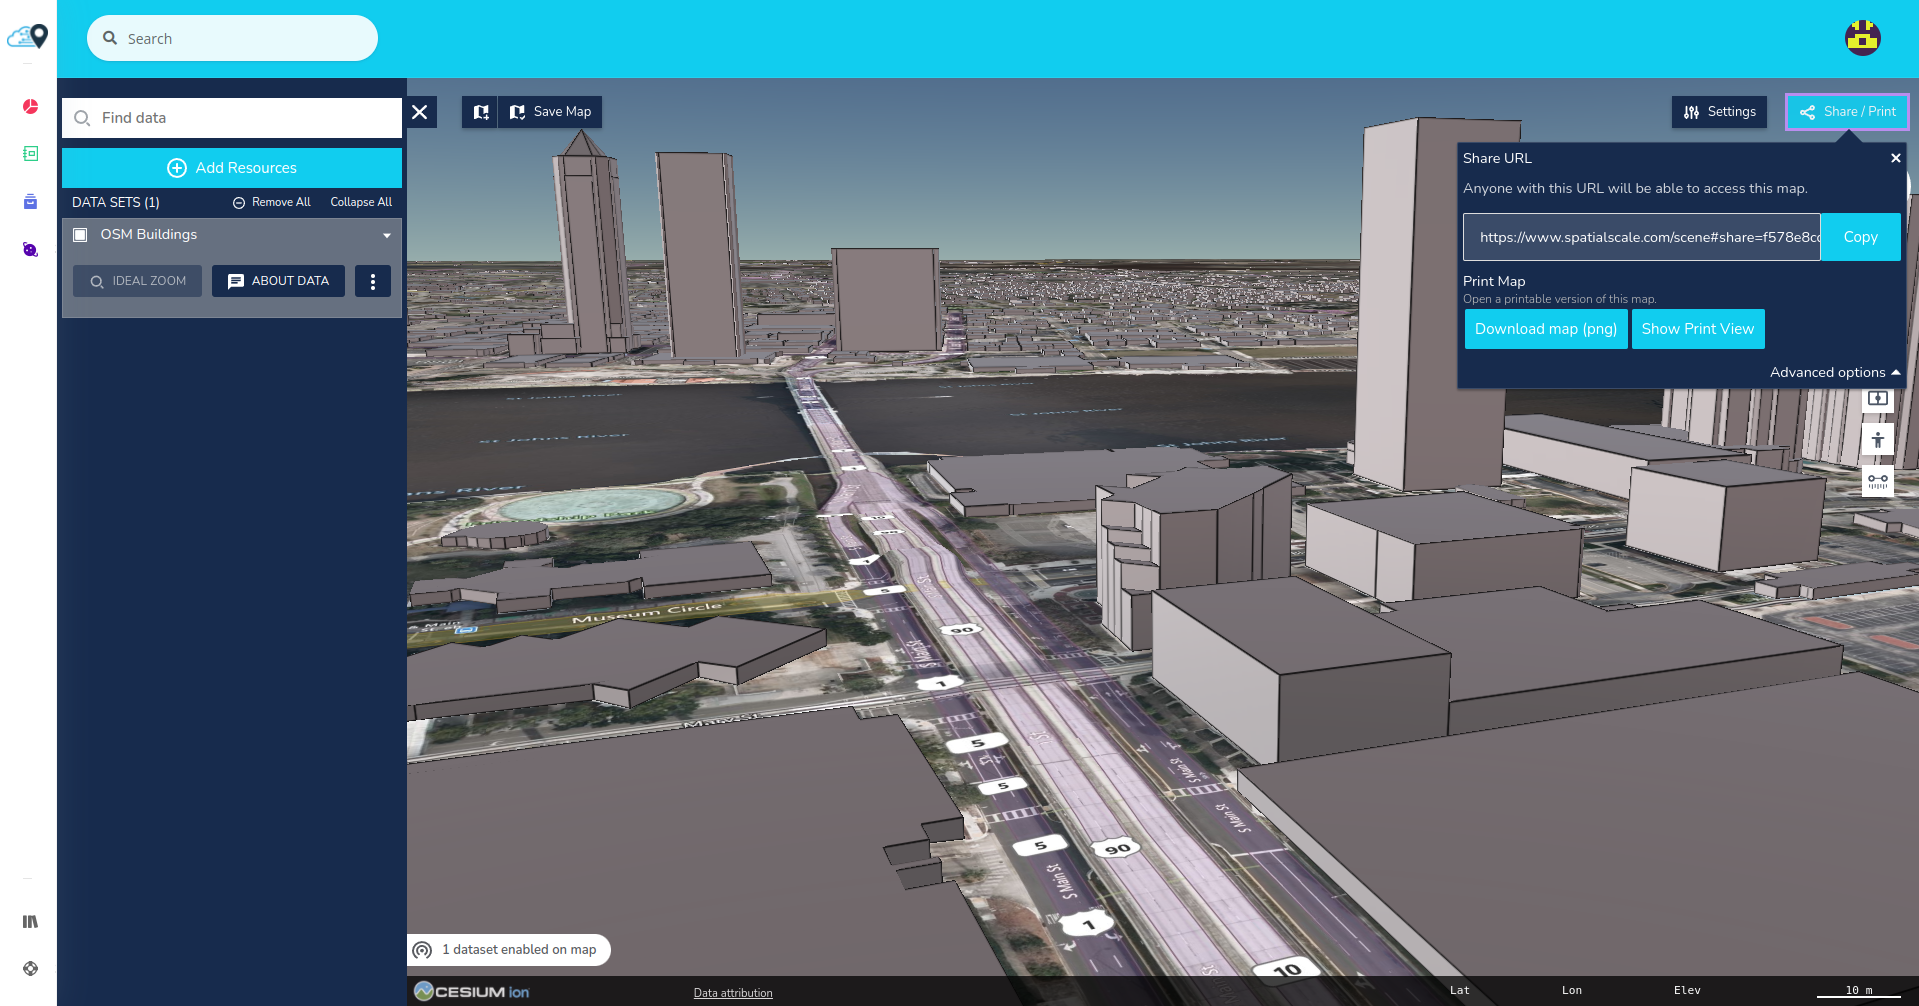
Sharing custom map views is now a breeze. Just click on the Share/Print button and copy the URL. When others open it, they’ll see the same data layers, zoom levels, and map states you’ve set up. It’s never been easier to collaborate and share insights with your team.
Classify Points
We’ve added AI/ML-assisted lidar point cloud classification. Now, you can classify ground, buildings, vegetation, and noise features with greater accuracy. This feature leverages GeoAI to make your data analytics smarter and more efficient.
Other Updates
DEM of Difference (Topographic Change): This new module in our surface tools helps you analyze topographic changes over time.
Contour Line Generation: We’ve extended our surface tools with this feature to give you more detailed geographical mapping capabilities.
Ready to Explore?
Check out our platform to see these features in action. Need help? Visit our help center for guides and support.
With these updates, SpatialScale continues to push the boundaries of geospatial software. We can’t wait to see how you’ll use these new tools to enhance your data visualization and analysis.


